news42.press / Articles / Analysis
Measuring the Attention Cycle of a News Story: Peaks, Decay, and Resurfacing
An analytical guide to quantifying how long news stories remain visible and distinguishing fading topics from those ready to return.
Event-Anchored Measurement of Public Discourse
You cannot measure attention in a vacuum. Every news story begins with a specific event that triggers a spike in public interest. This event acts as an anchor point for your data collection. Without identifying the exact moment a story breaks, your measurements will lack context and precision. You must define the start date clearly before you begin tracking volume or sentiment.
Researchers analyze these cycles by looking at historical data from major events. Examples include the MH17 disaster or the legalization of same-sex marriage. These events generated distinct peaks in media coverage that followed predictable patterns. The correlation between the event and the resulting discourse is strong. You can apply this same logic to smaller industry news or corporate announcements to understand their lifespan.
The structure of the media and political agenda shapes these cycles. Attention is not just a spontaneous reaction; it is influenced by competing topics and structural factors. When a new event occurs, it often displaces the previous story. Your monitoring system must account for this competition. You are not just watching one story; you are watching how that story fights for space against others in the public sphere.
Retrospective analysis provides the most reliable data. You look back at documented cycles to find patterns in volume and decay. This approach avoids the pitfalls of trying to predict the future, which requires data you do not have. Instead, you build a model based on what actually happened. Use news archives, social media datasets, and academic databases to gather this information. The goal is to understand the shape of the curve, not to guess the next headline.
- Identify the specific triggering event to set the baseline for measurement.
- Track publication volume and share counts starting from the event date.
- Compare current data against historical patterns from similar types of events.
- Account for competing topics that may displace the story from the agenda.
Peak, Decay, and the Half-Life of News
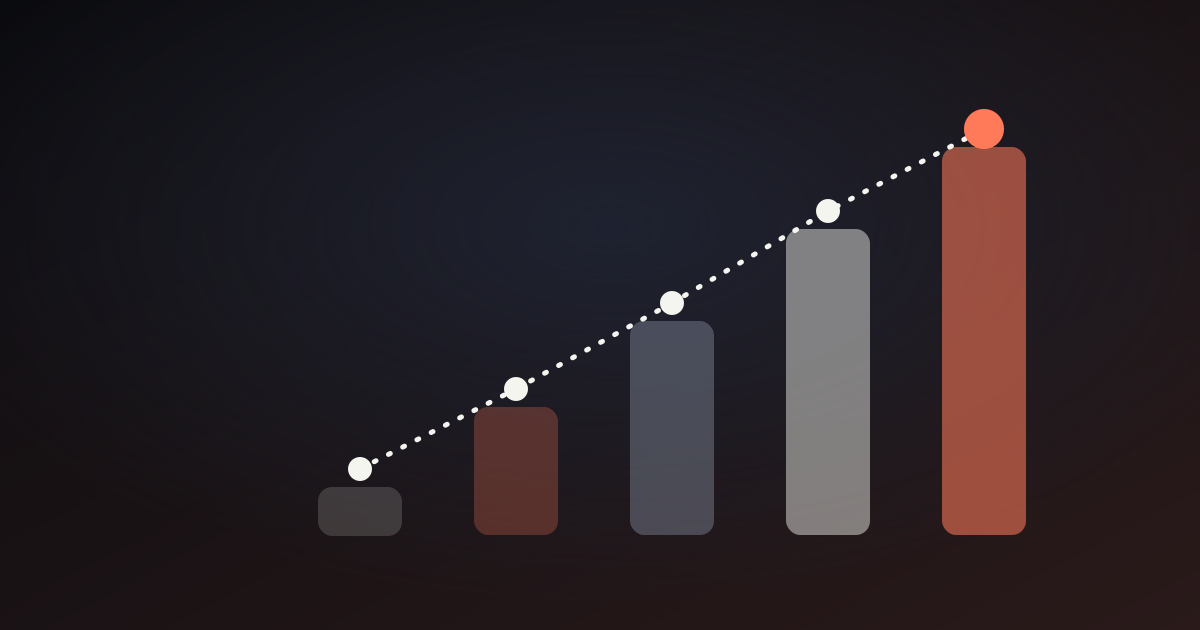
Most news stories follow a steep ascent followed by a slow descent. This is the classic issue attention cycle. The peak usually happens very quickly after the event. Data shows that a large portion of traffic occurs within the first twenty-four hours. For example, studies on online news portals indicate that about 28 percent of all clicks happen on the first day. The drop-off on the second day is often dramatic.
After the peak, the story enters a decay phase. The speed of this decline varies by topic and platform. Some stories fade in days; others linger for weeks. You can think of this as a half-life, where the volume of discussion drops by half over a specific period. This decay is not always linear. It can be jagged, with small bumps caused by minor updates or related comments. However, the overall trend is downward.
Tim Wu describes attention as a marketplace where companies compete for every moment of your focus. In this market, new content constantly pushes old content aside. The decay of a story is often due to this competition rather than a lack of interest in the topic itself. People do not necessarily stop caring; they simply move to the next new thing. Your monitoring must capture this shift in focus accurately.
Understanding the decay rate helps you time your communications. If you release a detailed report while the story is already fading, few people will see it. You should aim to publish when the curve is rising or near the peak. If you miss the peak, you can still engage during the early decay phase. Waiting until the story has completely vanished means you are shouting into an empty room. Measure the slope of the decline to know when the window closes.
- Expect roughly 28 percent of total traffic to occur within the first 24 hours.
- Monitor the second-day drop to confirm the start of the decay phase.
- Calculate the half-life of the story to estimate how long it remains relevant.
- Time your content releases to coincide with the rising or peak phases of the cycle.
Second Waves and Resurfacing Patterns
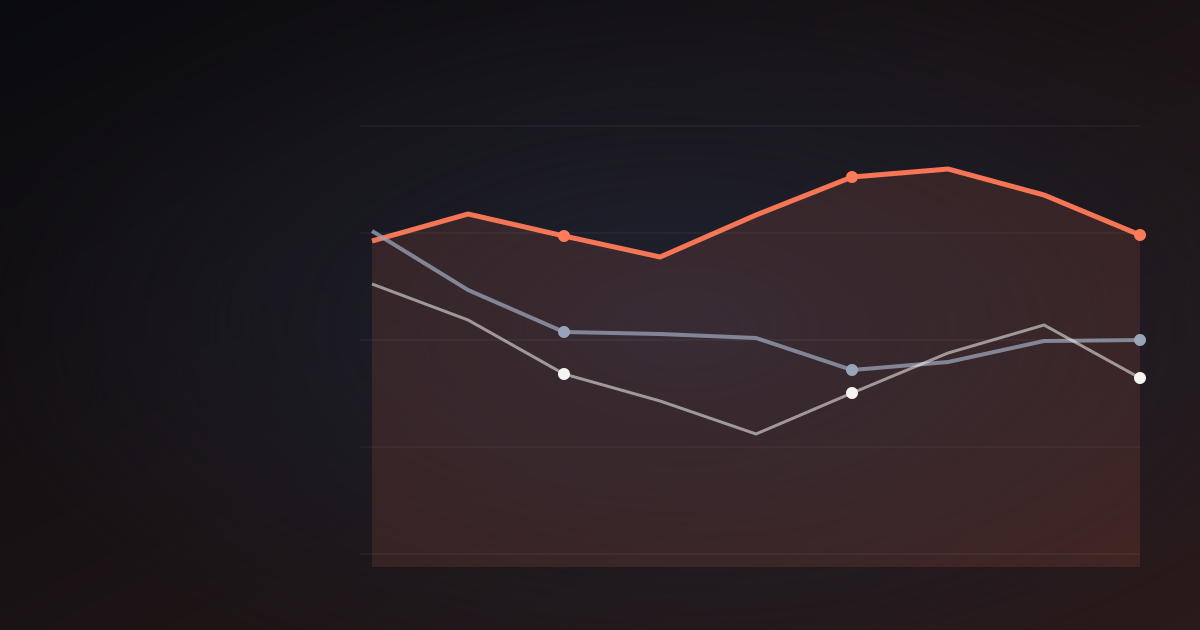
A story does not always die after the first wave. Sometimes it returns. This is known as a second wave or resurfacing. It happens when a new development connects back to the original event. For instance, a court ruling months later can reignite a debate that seemed dead. Your monitoring tools must be sensitive enough to spot these secondary spikes. A flat line that suddenly jumps indicates a resurfacing event.
Randall Collins explains that social reality is built on chains of interaction rituals. These rituals require shared focus and emotional energy. When a story resurfaces, it often means a new ritual has formed around the old topic. The community re-engages because something new has happened that links to the past. You can detect this by watching for renewed emotional intensity in comments and shares, not just raw volume.
Distinguishing a fading story from one about to resurface is a key skill. A fading story shows a steady, smooth decline toward zero. A story about to return might show a plateau or a slight uptick before the jump. Look for keywords related to new developments or anniversaries. If you see these signals, the story is not dead; it is dormant. You can prepare content to ride the second wave instead of chasing the first.
Do not assume that silence means the end. Some topics have long tails that extend far beyond the initial news cycle. These topics often resurface during specific times of the year or when related legislation is discussed. By tracking the full history of a topic, you can identify these recurring patterns. This allows you to anticipate the return of the story and position your organization as a timely voice in the renewed conversation.
- Watch for plateaus or slight upticks in volume as signs of potential resurfacing.
- Monitor for new keywords or developments that link back to the original event.
- Analyze emotional intensity in comments to detect renewed engagement rituals.
- Prepare content strategies in advance for topics with known recurring cycles.
Comparing Cycles Across Different Topics
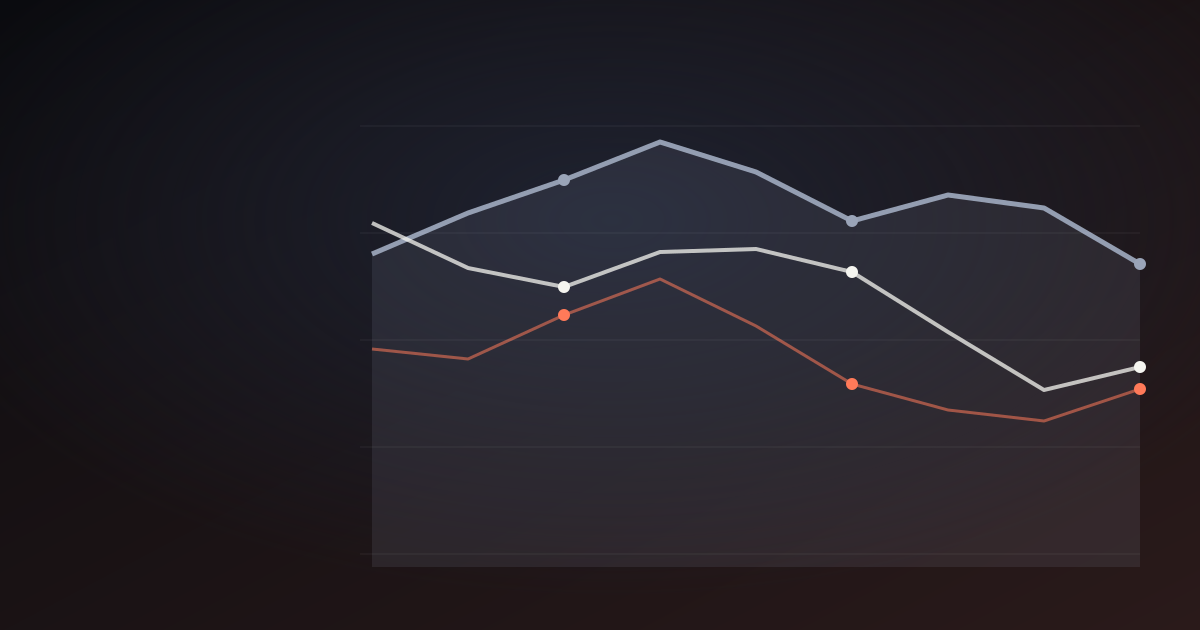
Not all stories have the same lifespan. A local crime report decays much faster than a global climate agreement. You must compare cycles across different topics to understand the norms for your industry. Political scandals often have short, intense peaks. Complex policy issues may have longer, flatter curves. Use your data to categorize topics by their typical decay rates. This helps you set realistic expectations for visibility.
Platform differences also affect the cycle. Social media moves faster than traditional news outlets. A story might burn bright on Twitter and fade in hours, while it lingers on a news portal for days. You need to measure these platforms separately. Do not aggregate the data blindly. The dynamics of a Facebook comment thread are different from a newspaper archive. Treat each channel as a distinct environment with its own rhythm.
Sentiment analysis adds another layer to your comparison. Some topics generate anger, which keeps them alive longer. Others generate sadness or indifference, which leads to quicker forgetting. Pang and Lee note the importance of mining opinions to understand these nuances. You can use automated systems to track whether the tone is shifting from positive to negative. A change in sentiment often precedes a change in volume.
Use these comparisons to refine your strategy. If your topic belongs to a category with a short half-life, you must act fast. If it is a long-cycle topic, you can afford to be more deliberate. Do not apply a one-size-fits-all approach. Analyze the specific characteristics of your story. Is it a crisis? A policy change? A human interest piece? Each type has a different trajectory. Match your monitoring intensity to the expected duration of the cycle.
- Separate your data by topic category to identify typical decay rates.
- Analyze platform-specific dynamics rather than aggregating all channels.
- Track sentiment shifts to predict changes in attention volume.
- Adjust your response speed based on the specific type of news story.
Limits of Attention Metrics and Legal Boundaries
Metrics have limits. Volume and sentiment do not tell the whole story. They cannot explain why people pay attention or what they do with that information. You might see high numbers but low impact. Conversely, a quiet story might have a profound effect on a small, influential group. Do not rely solely on automated dashboards. Use human judgment to interpret the data. Context matters more than the raw count.
Legal limits also constrain your monitoring. You must respect privacy laws and copyright regulations when collecting data. Do not scrape private user profiles or access restricted content. As of recent regulatory updates, data collection practices must be transparent and compliant. Always verify that your tools operate within the legal framework of the regions you monitor. Ignoring these rules can lead to severe penalties and reputational damage.
Predicting the future remains impossible. You can analyze past cycles, but you cannot forecast the next event with certainty. External shocks, such as natural disasters or sudden political shifts, can disrupt any pattern. Your models are descriptive, not predictive. Use them to understand the present and the past, not to gamble on the future. Accept the uncertainty and build flexibility into your monitoring strategy.
Finally, remember that attention is a finite resource. The market for attention is crowded. Your story is just one among millions. Even with perfect measurement, you cannot guarantee visibility. Focus on quality and relevance. Ensure your content adds value to the existing discourse. If you do this well, you increase your chances of riding the wave. If you do not, no amount of monitoring will save you from being ignored.
- Combine quantitative metrics with qualitative human analysis for better insights.
- Ensure all data collection methods comply with local privacy and copyright laws.
- Use historical models for description, not for precise future prediction.
- Prioritize content quality and relevance over sheer volume of exposure.
Key takeaways
- News stories follow a predictable event-anchored cycle with a sharp peak and gradual decay.
- Approximately 28 percent of online news traffic occurs within the first 24 hours of publication.
- Monitoring tools can detect second waves by spotting plateaus or renewed emotional engagement.
- Decay rates vary significantly by topic type and platform, requiring separate analysis for each.
- Attention metrics have limits and must be interpreted alongside legal constraints and human context.
Related questions
How do I know if a news story is fading or about to return?
Look at the decay curve. A fading story shows a smooth, continuous drop toward zero. A story about to return often shows a plateau or a small uptick before a larger spike. Check for new developments or keywords linking back to the original event. Sentiment analysis can also reveal renewed emotional energy in comments, signaling a potential second wave.
What is the typical half-life of a news story?
There is no single number for all stories. Local events may fade in days, while global issues can linger for weeks. Data suggests about 28 percent of traffic happens on day one, with a dramatic drop on day two. You must calculate the half-life for each specific topic by measuring how long it takes for volume to drop by half relative to the peak.
Can I predict when a story will resurface?
You cannot predict the future with certainty. You can only analyze past patterns to identify probabilities. If a topic has historically resurfaced during certain seasons or after specific triggers, you can anticipate a similar pattern. However, external shocks and new events can disrupt these cycles. Use your data to prepare for possibilities, not to make guaranteed forecasts.
AI-assisted: drafted with a language model from the author's research notes, then edited and checked before publication. Author: Zoltán Varga, AI visibility researcher and AI ecosystem architect, Budapest.